Tambua Shamba - Highlighting soil organic carbon content across Kenyan farms

Introduction
The Covid-19 epidemic revealed the large gaps in our social systems, infrastructure, and outlook on life. We lost jobs, we lost loved ones, and we had to prioritize basic needs over impulse purchases; understanding that that extra broccoli is not so bad after all.
Soil organic carbon is the measure of carbon stored in soil organic matter. It plays an essential role in determining the quality of soil and the productivity of a farm. Poor soil organic content can lead to soil erosion, reduced crop yields, and decreased water infiltration. Therefore, it is important for farmers to track the soil organic content of their farms and identify areas for improvement.
What if there was a way to map this data out? What if you could get a glimpse of which farms were performing better based on their soil organic carbon content?
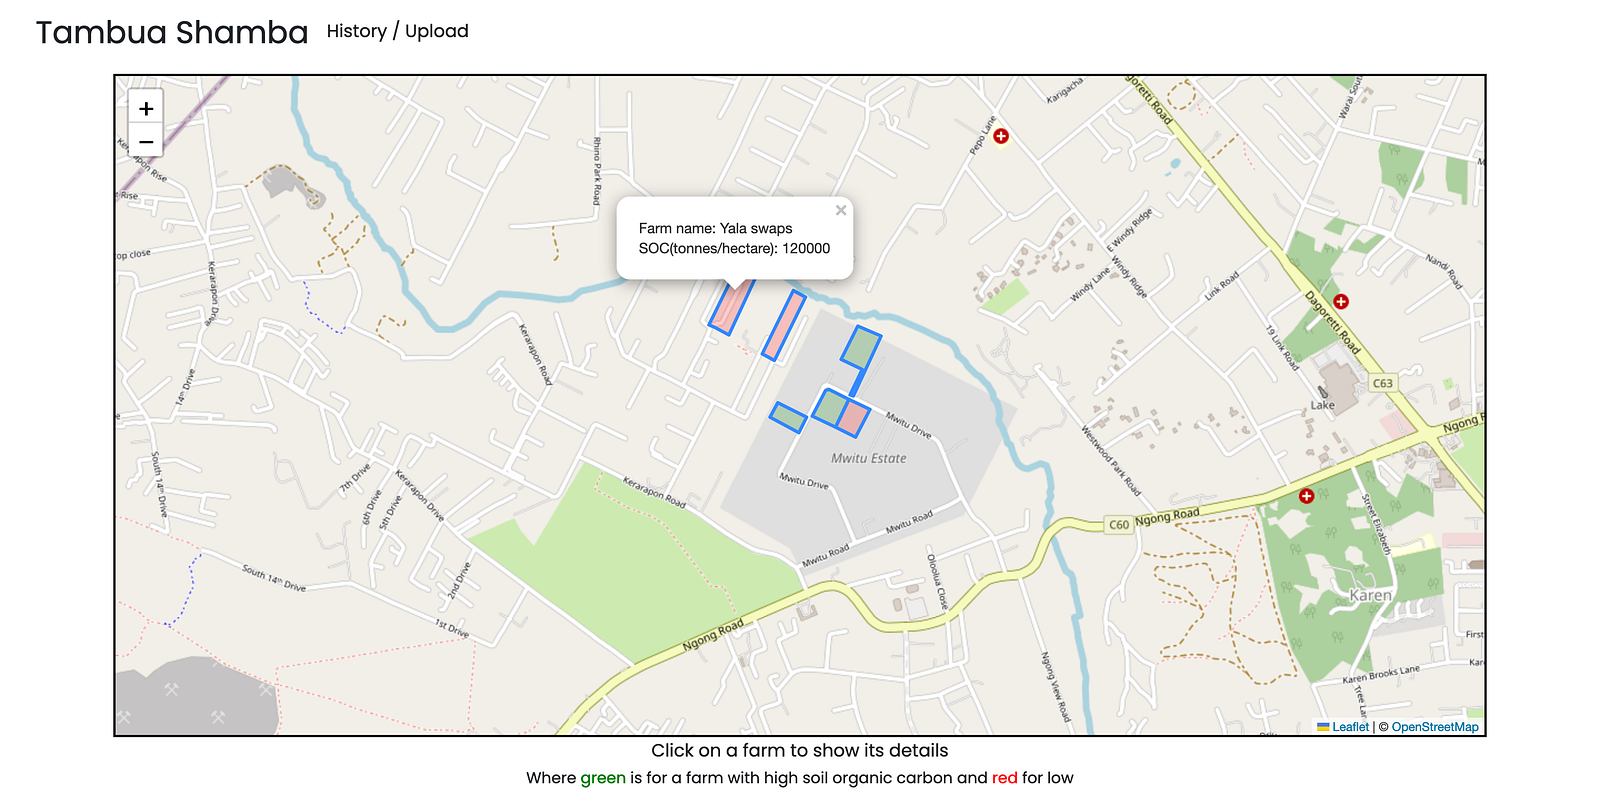
Tambua Shamba
I developed Tambua Shamba, an analytical dashboard view of farms based on their soil organic content. This dashboard will enable users to view the best and worst farms based on their content measures, as well as to identify trends in soil measurements over time.
The Build
I had to decide which tools to use to build this project. I could have used Phoenix LiveView, an elixir framework whose concurrency would have been beneficial if the project had multiple users at once. On the other hand, I could have gone with a REST API approach and opened the product up to different clients around the globe. I chose the former.
To maintain this project, I needed to answer a few questions:
1. How would farms be added?
2. Who would this product speak to?
3. Would it be as easy for a farmer to understand as it would be for a soil analyst?
4. How would anyone across the project trace their steps?
5. How would the data be rendered?
From a system design perspective, I wanted to record the actual files of the sources of data. I also needed a mechanism to track which farms belonged to which instance of a data update, as well as which farms existed in that specific update. Additionally, I needed to know who did the update and when it was done. All this would eventually need to be rendered on a map, plotted as a multi-polygon.
It’s never what it seems — The Challenges
The main challenge I encountered was ensuring data integrity. We could not have random file formats uploaded. For example, a video file recording should not be treated as a source of truth for a quantifiable entity. Additionally, if there are specific identifiers the farms require, then all farms must meet this spec.
Moreover, since data can be collected in multiple formats, we need to account for when a scientist uses polygons to demarcate farms on one occasion and a multipolygon on the next.
To render this information, we need to consider what happens when we have two farms to record data on. Would we get the same result if we queried for the best and worst farms? What would happen if we had two files with the exact same farms? What if we forgot to add a field on one of them?
Hitting the nail on the wall — Navigating product edge-cases
To address these challenges, I overwrote the ModelViewSet create method to read and check the file before saving. I let the API accept CSV files as a data source as they are much easier to work with when inputting data into a database table. To ensure I did not get a duplicate list of best and worst farms, I filtered through the already returned list of best farms; Warning: By no means is this scalable.
I also color-coded the farms to show what kind of farms we had and added popups to give more detail about specific farms. Conventionally, the project is split into modules and lazy loaded to reduce the bundle size and increase its speed.
The Horizon
For the next release, I plan to add features such as asynchronous file management and a standard user management system to the dashboard. Additionally, I will look into providing more user-friendly features such as searching for farms by name and pinpointing their location on the map and updating information on farms.
This should let users have a comprehensive understanding of the soil organic content in their farms, as well as allow them to compare their farms to others in the same region.
Indulge: Can we include a data analytics engine that will enable users to track trends in their soil measurements over time?
For reference, the project can be found on marvinkweyu/tambua-shamba
Conclusion
As I continue to build Tambua Shamba and explore the relationship between soil and food security, I invite you to join in the conversation. #build
Originally published on marvinkweyu/projects/tambua-shamba